Some examples on Cartographic related research at Geomatics group the last years:
Creating better maps of the subsurface
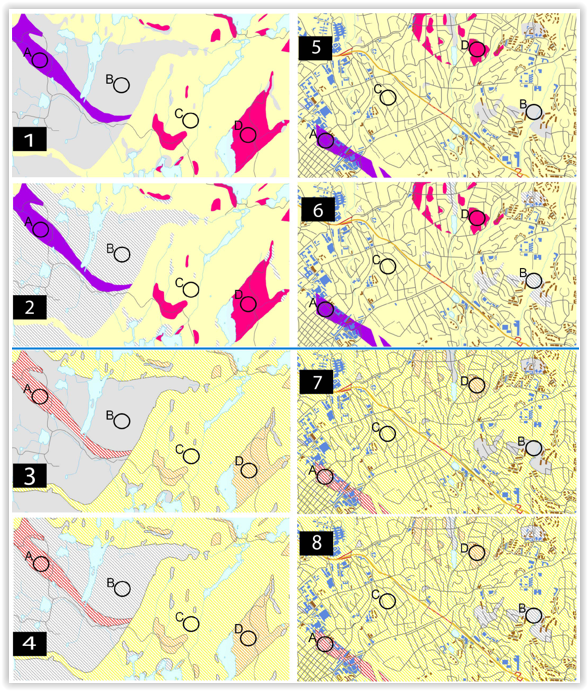
Due to complicated geological structure, geological information are difficult to understand for “then man in the street”. At the same time there are societal and environmental benefits of making geological information easier to use. A part of the project is to study the cartography for existing maps through web-experiment. Here is an example where a Radon map is tested:
Spatio-temporal weather maps
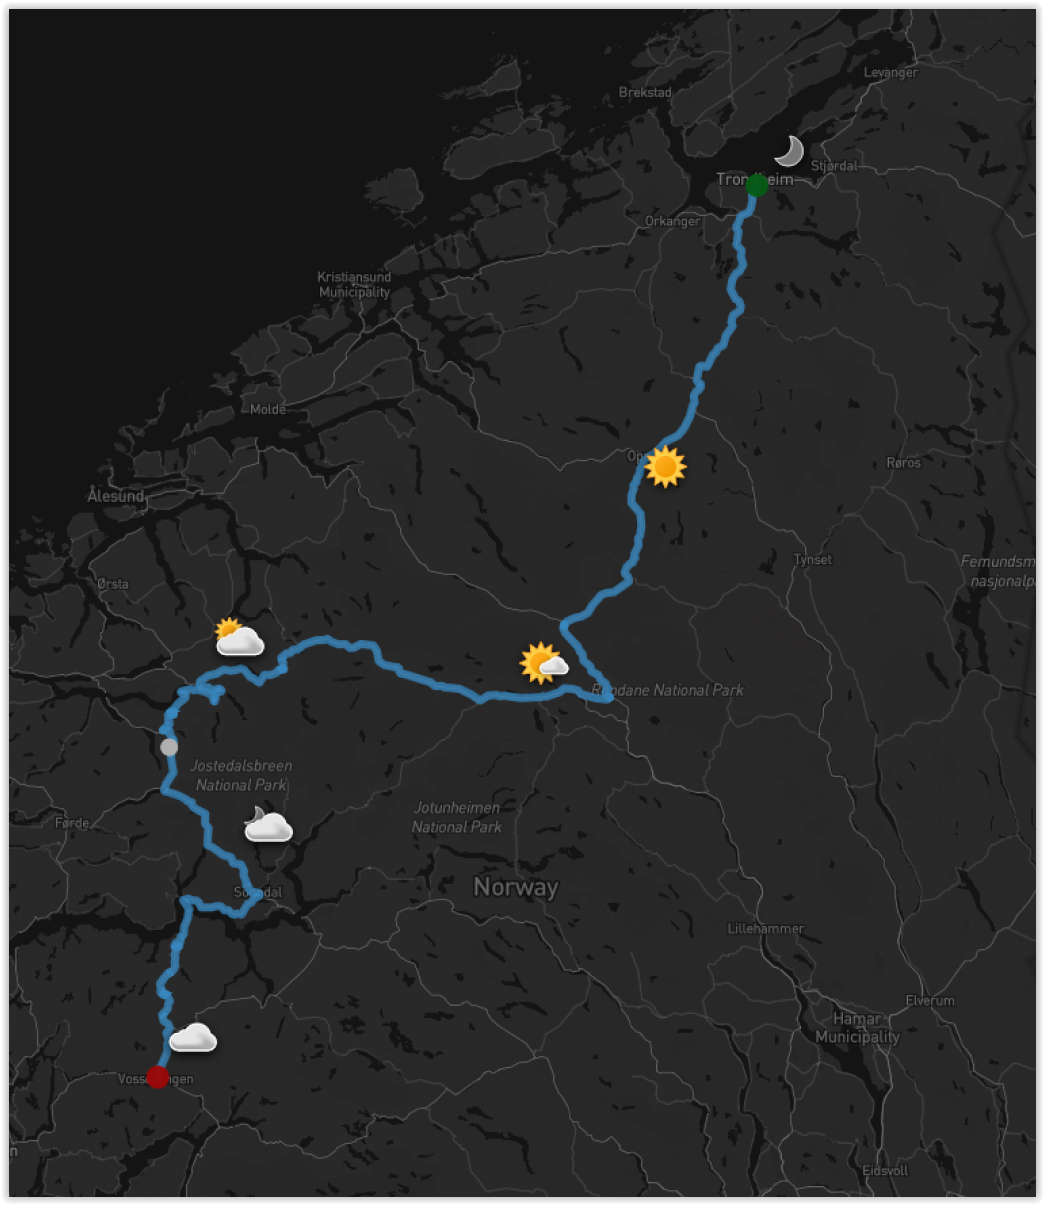
This master project were focusing on extracting and communicating weather information along a travel route. The weather forcast at different points along the route are based on the actual time when passing the point. Cartography and methods were tested through a web-experiment.
Geospatial Knowledge Graph for Visual Analysis
Geospatial knowledge graph is a semantic technology that structurs geodata in the form of a graph, in which nodes represent entities, places, geometries, or values. This approach is highly relevant for geodata integration and can thus provide a basis for visually analyzing big geospatial data. Figure X shows a visual analytical interface for exploring weather and traffic sensor data based on knowledge graph approach.
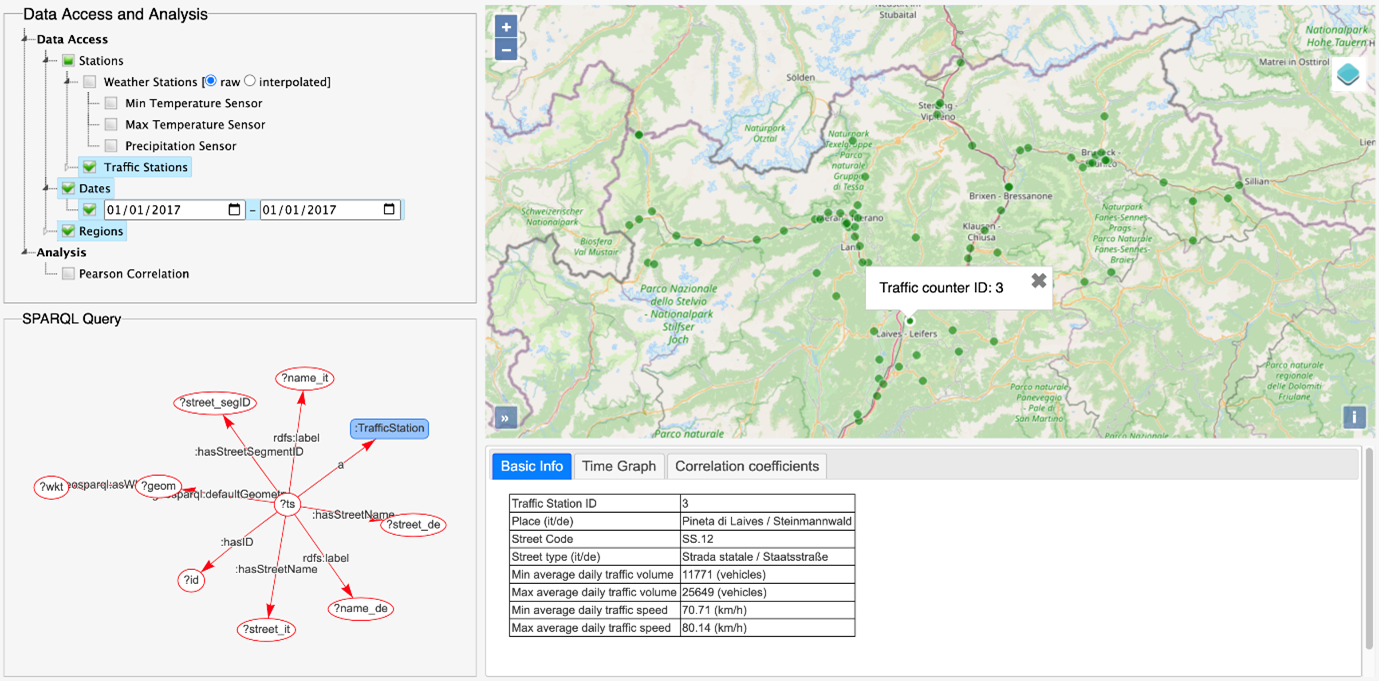
The figure shows an interactive visual analytical interface for exploring weather and traffic sensor data based on knowledge graphs, consisting of the core geospatial concepts (upper left), the structure of SPARQL queries (lower left), the spatiotemporal distribution of the stations, sensors, and meteorological and traffic observations (right).