Norwegian Institute of Bioeconomy Research (NIBIO) is conducting research and providing information about the land resources including land cover, forest, soil, vegetation and landscape. NIBIO is to contribute to food security and safety, sustainable resource management, innovation and value creation through research and knowledge production within food, forestry, and other biobased industries.
NIBIO is a leading Norwegian scientific institution regarding use of forest resources, forest ecology, landscape, and land monitoring. The institute is also responsible for a range of national mapping programmes and resource inventories related to land cover, forestry, agriculture, landscape, and the environment – including the Norwegian part of the pan European CORINE Land Cover map.
The institute is a national institute under the Ministry of Agriculture and Food. NIBIO provides knowledge to the authorities, industry, commerce, and the public to contribute to the sustainable management and formation of values of land resources through research and data collecting.
The institute has approximately 700 employees in total. The main office is in Ås, just south of Oslo, and 14 regional offices are located in Northern Norway, Mid Norway and Western Norway. The data are collected through field surveys, by image interpretation or automatically retrieved by computer assisted image processing. The collected data are presented in different ways: as reports, statistics and maps. The institute produces many various thematic maps. Several departments and about 10 skilled employees are involved in the map designing. A great effort is being put into cartography to ensure readable maps of high quality that are easy to understand.
The majority of the mapping software used by the institute is open source; the data are stored in PostgreSQL object relational database using PostGIS, GeoTools and GDAL for different and complex GIS tasks. Data collection in the field is carried out with QField on cell phones and tablets. We use QGIS for analyses, visualization and creating maps and illustrations. The production of paper maps is small – mainly made on demand for different purposes and for grazing land for sheep and cattle. Most of our data are presented interactively on the internet. Our internet application for viewing and downloading data is entirely based on open source software like GeoServer, MapServer, OpenLayers, Leaflet and GeoExt. The layout and colours on the analogue maps may differ from the digital version of the datasets for optimizing the readability depending on paper or screen.
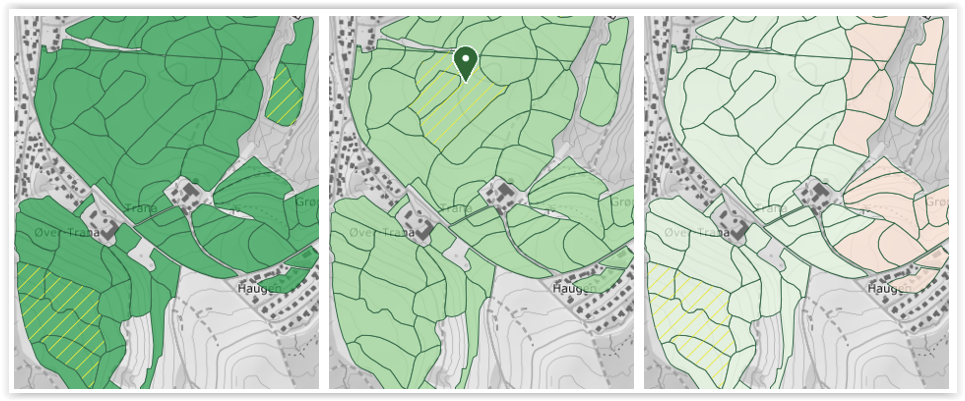
Screen dumps from the viewing application zoomed in to show the potential of cultivation cauliflower (to the left), carrot (in the middle) and Brussel sprouts (to the right) in Steinkjer in the middle of Norway based on weather and soil.
Weather conditions are shown with green colour while soil quality (texture in the plough layer) is shown with yellow hatch pattern. The darker green, the more suitable weather for cultivating. If hatch is present, the texture is less suitable for growing vegetables. Dark green is best (good weather and good texture), dark green with hatch is second best (good weather, but less good texture) etc. The beige colour indicates that neither weather nor texture are in favour of cultivating Brussel sprouts.
When you click on a polygon, a “Position-icon” will be placed in the chosen polygon and a pop-up window will give you information about the classification and how it was mapped and when.
Example from the carrot-polygon marked above:
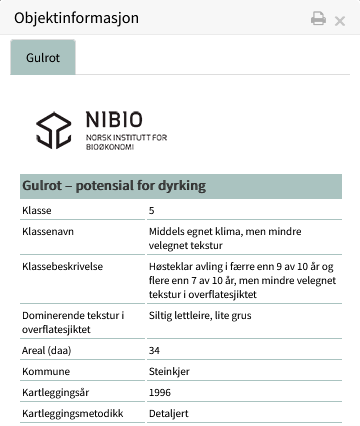
Source: http://kilden.nibio.no tab “Jordsmonn” (eng. soil).